Category: interaction

Sending motion data to the Blynk app (part 2 of the Blynk tutorial)

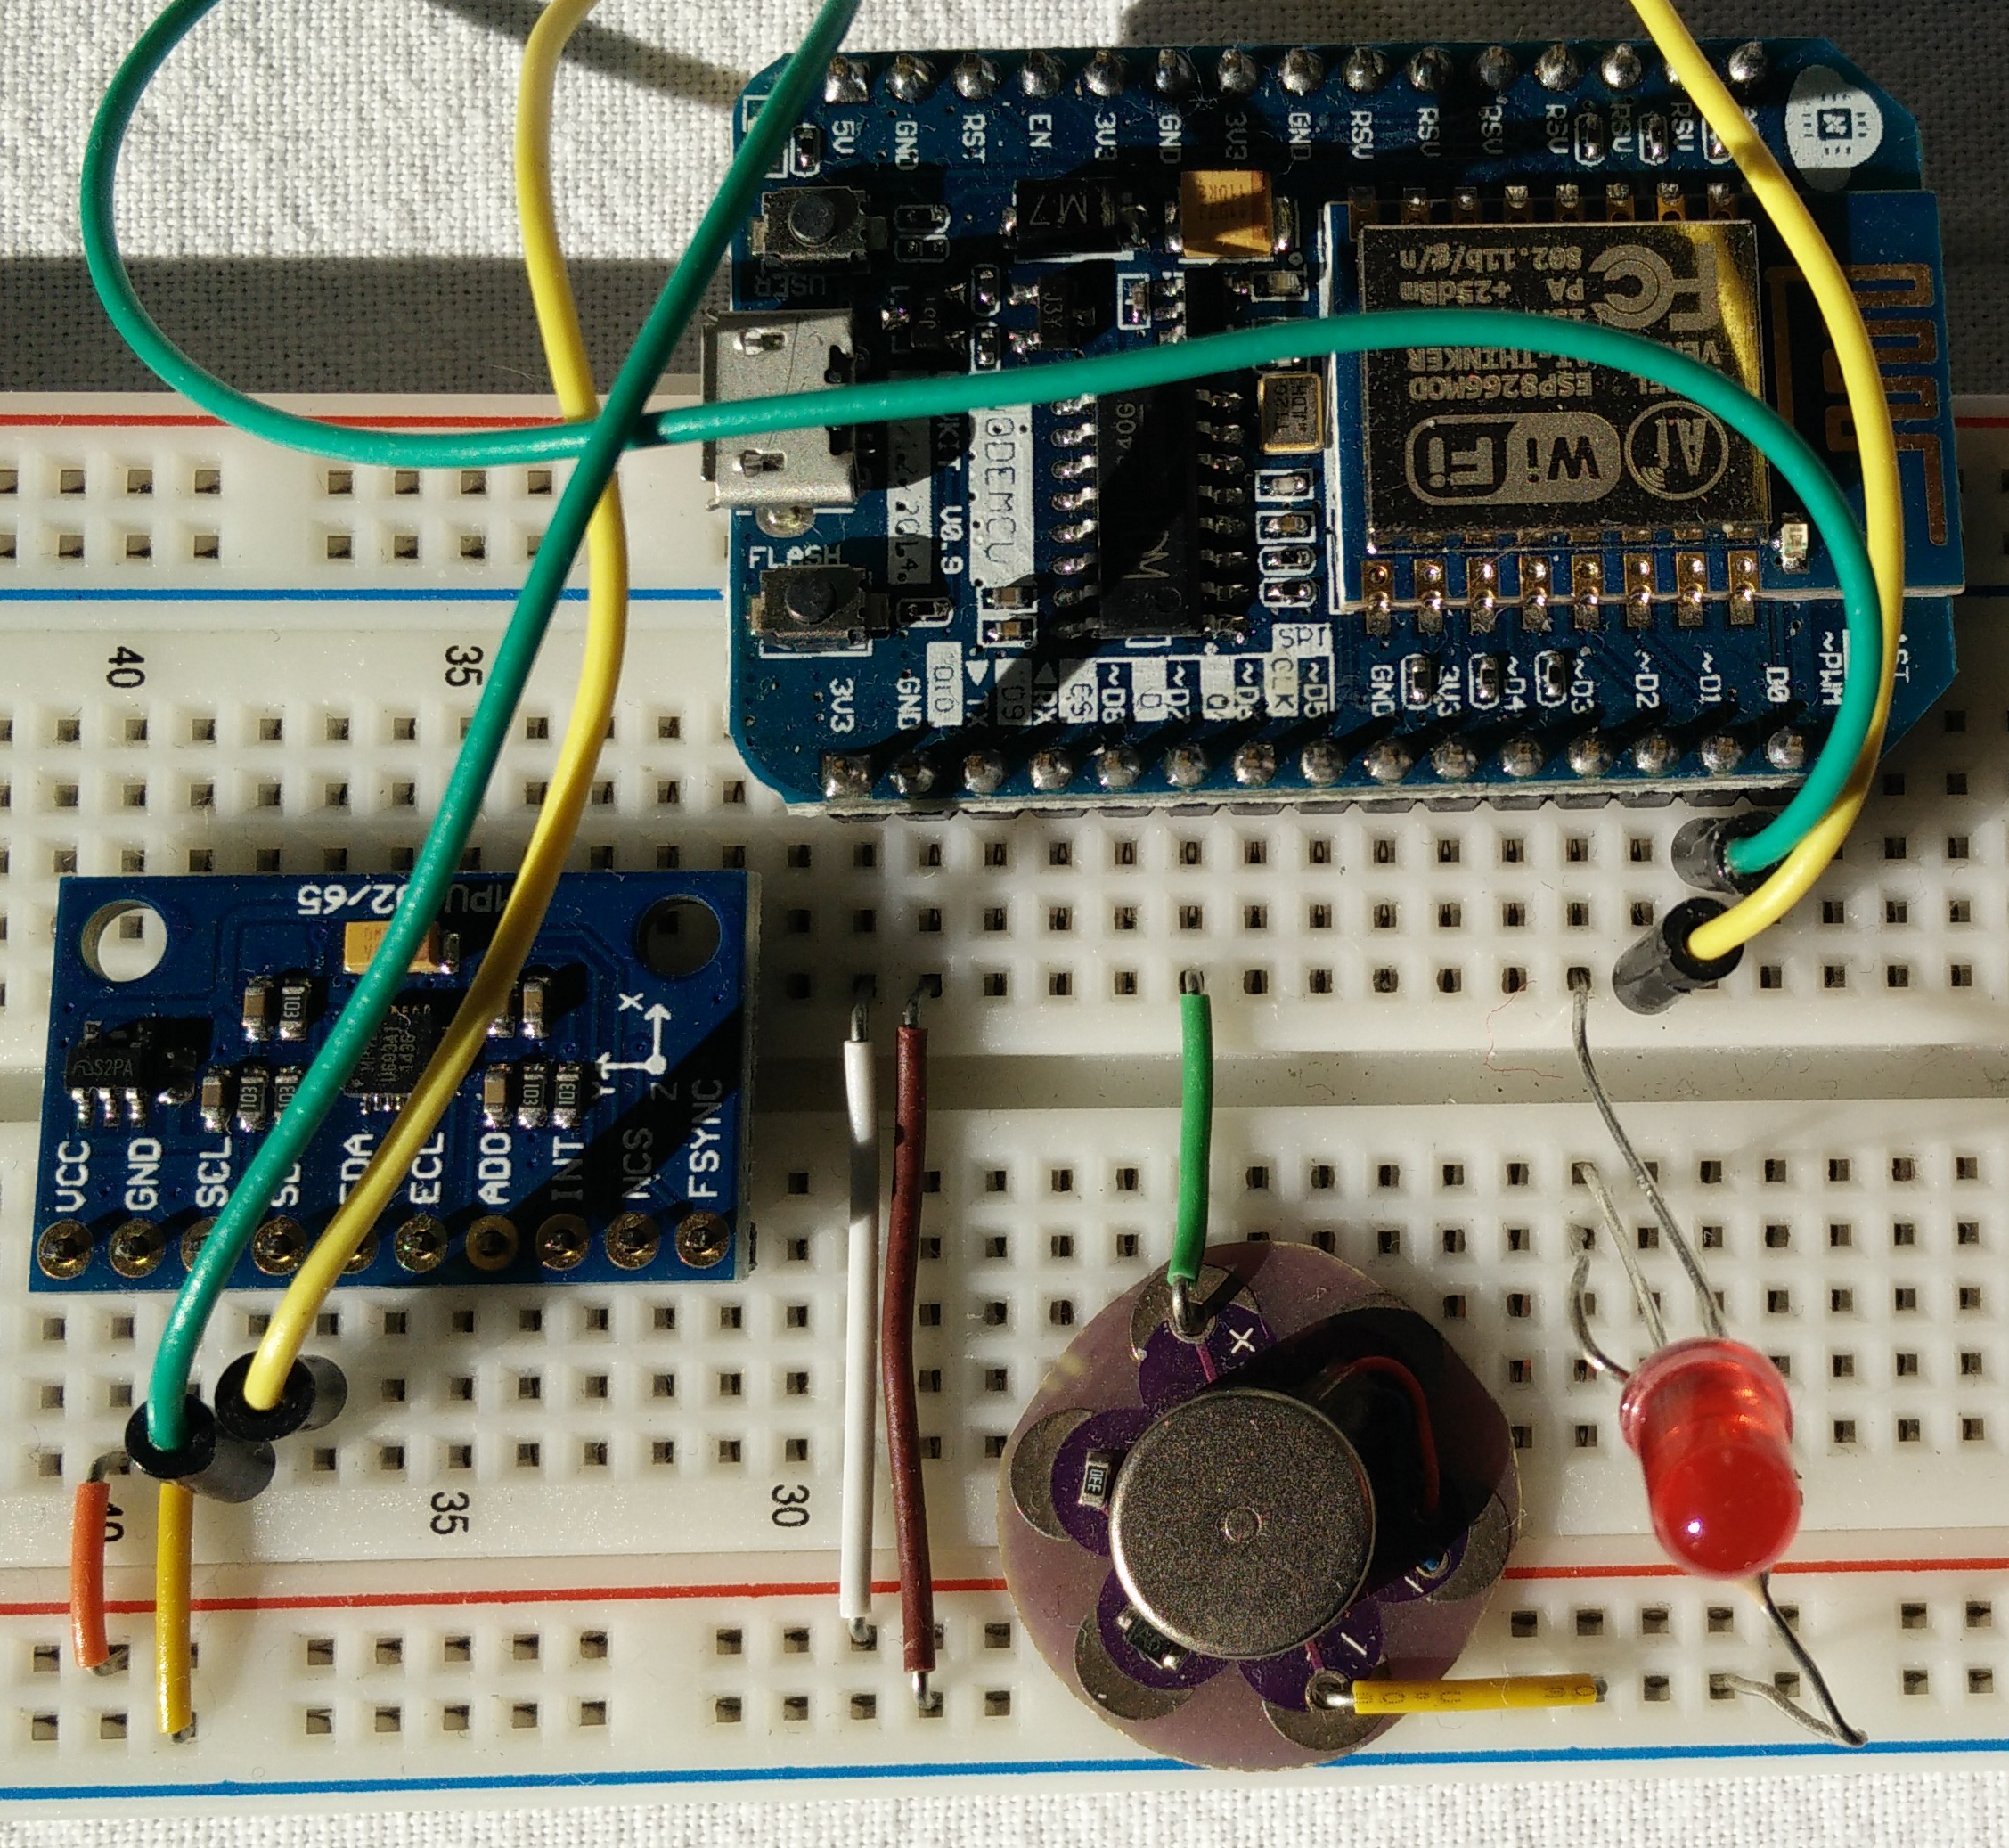
In the first blog post we explained the basics of controlling the body interaction 2 (BI2) vibrator development board using the concept of  (virtual) pins. This time we want to send data from the BI2 board to the Blynk app. The BI2 has the MPU-9250 9DoF (9 Degrees of Freedom) IMU (Inertial Measurement Unit) sensor on board. This sensor is a combination of an accelerometer, gyroscope and magnetometer. Especially the accelerometer is important for motion detection. This could be used for controlling the vibrator as show with the body interaction 1 (BI1).

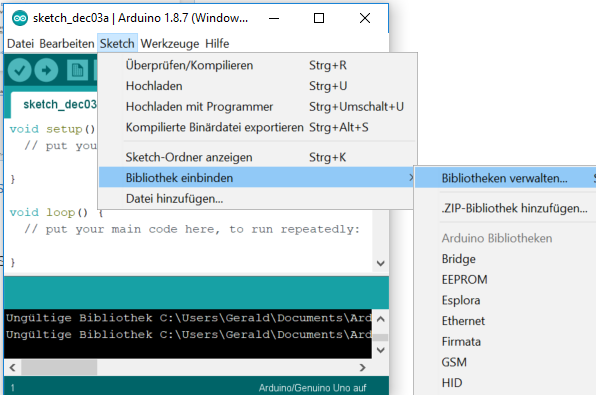
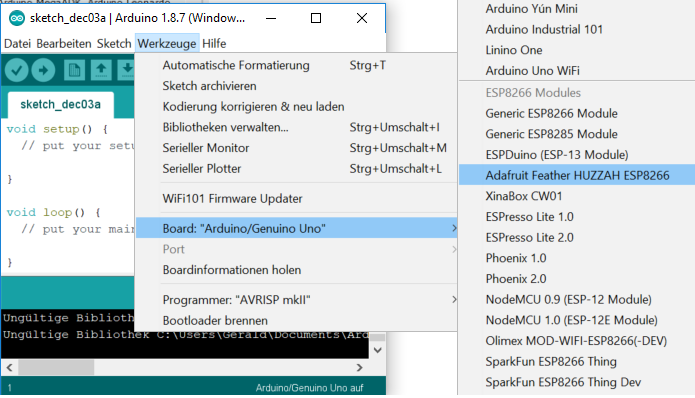
For measuring the motion data we use the asukiaa library. Please search and install the library in the Arduino library manager.

In the program code the library must be included and a MPU9250 sensor object must be defined. Finally we need several variables of the type float.

#include <MPU9250_asukiaaa.h>
MPU9250 mySensor;
float aX, aY, aZ, mDirection, pitch, roll, yaw;

In the setup part of the program we need to tell the MPU9250 how it is connected to the ESP8266 microcontroller. [The MPU9250 IMU is connected by the I2C bus to the ESP8266 microcontroller: the sda pin of the IMU is connected to pin 4, the scl pin to pin 5. The connection between MPU9250 and ESP8266 is managed with the standard Wire library.]

For using the accelerometer and magnetometer we have to initialize the sensor with a begiAccel() call to the IMU library.

Wire.begin(4, 5); //sda, scl
mySensor.setWire(&Wire);
mySensor.beginAccel();
mySensor.beginMag();

We have to tell the program how often data is sent to the app. Therefore we need an important concept in microcontroller programming:

Timer

With the help of the timer we can tell the microcontroller to do a given tasks again and again e.g. after 1000 microsecond. You cannot use the delay function to pass time as this would interrupt the important call to the Blynk.run(); function which is located in the loop part of the program.

First we have to define an object of type Timer.

BlynkTimer timer;

In the setup part we have to say how often what the timer has to do. in this example the timer will call the function myTimerEvent every 1000 microsecond.

timer.setInterval(1000L, myTimerEvent);

In the loop part of the program we have to call the timer to keep things going:

timer.run(); // Initiates BlynkTimer

Now we need the function myTimerEvent what has to be done every 1000 seconds.

void myTimerEvent()
{
  // here add was has to be done
}

First we have to update the sensors (accelUpdate, magUpdate). Then we read out the acceleration data in the X, Y and direction. You can already use this data but they are hard to catch. Therefore we can calculate the pitch, roll and yaw. These are angles from -180° to +180°. The calculation is complicated and I don’t understand it. But with the given formulas you get a very rough approximation which makes the data quite accessible.

void myTimerEvent() {
  mySensor.accelUpdate();
  aX = mySensor.accelX();
  aY = mySensor.accelY();
  aZ = mySensor.accelZ();

  // calculate pitch, roll, yaw (raw approximation)
  float pitch = 180 * atan (aX/sqrt(aY*aY + aZ*aZ))/M_PI;
  float roll = 180 * atan (aY/sqrt(aX*aX + aZ*aZ))/M_PI;
  float yaw = 180 * atan (aZ/sqrt(aX*aX + aZ*aZ))/M_PI;

  // read gyroscope update
  mySensor.magUpdate();
  mDirection = mySensor.magHorizDirection();
}

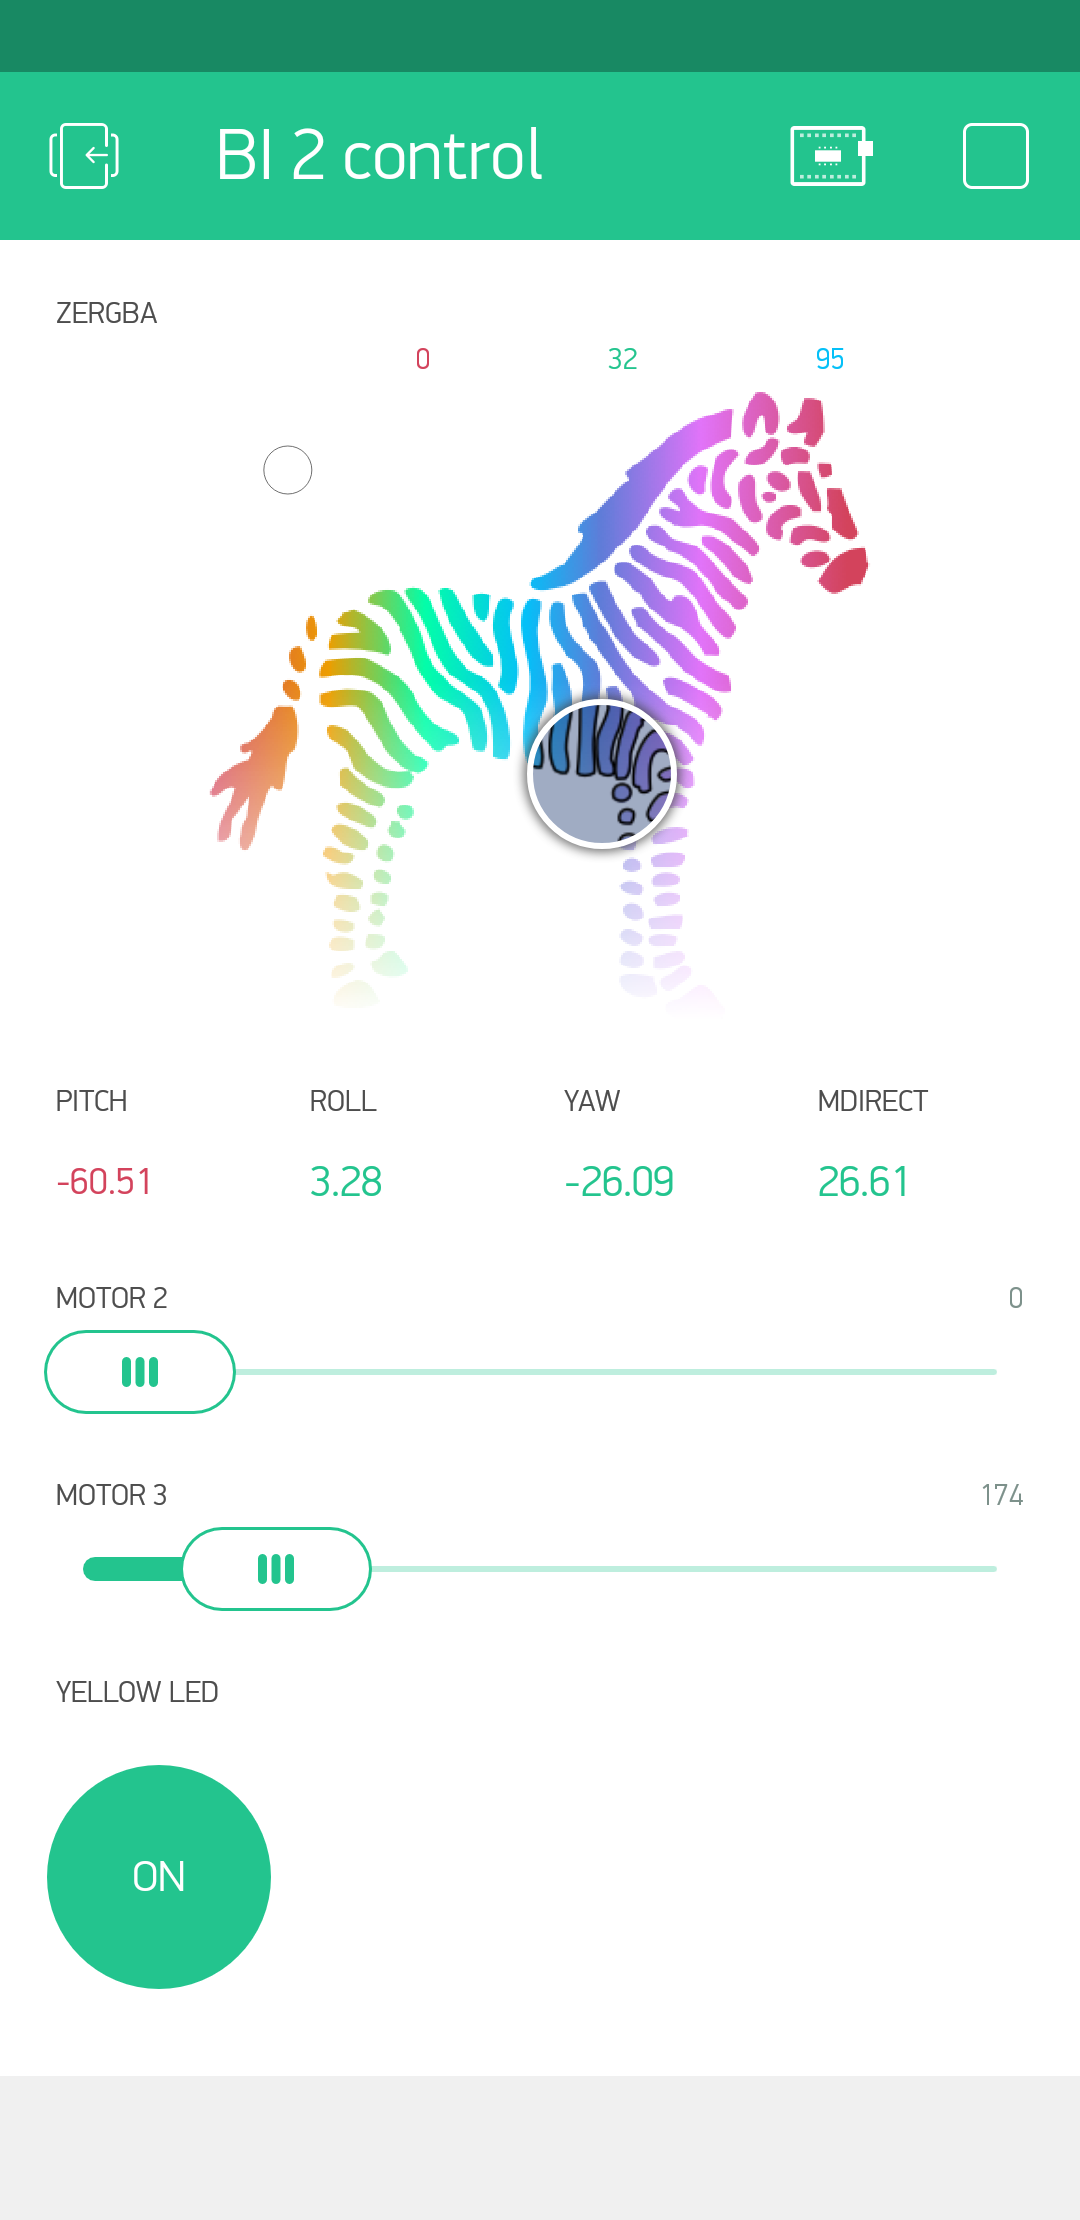
Finally we send the data back to the Blynk app. Now we use the virtual pins. For the variables pitch we  use virtual pin 2 (V2), for roll V3, for yaw V4 and for mDirection V5. We have to add the following line to the myTimerEvent function.

void myTimerEvent() {
  // send data to app via virtual ports, e.g. virtual pin V2 is set to pitch
  Blynk.virtualWrite(V2, pitch);
  Blynk.virtualWrite(V3, roll);
  Blynk.virtualWrite(V4, yaw);
  Blynk.virtualWrite(V5, mDirection);
}

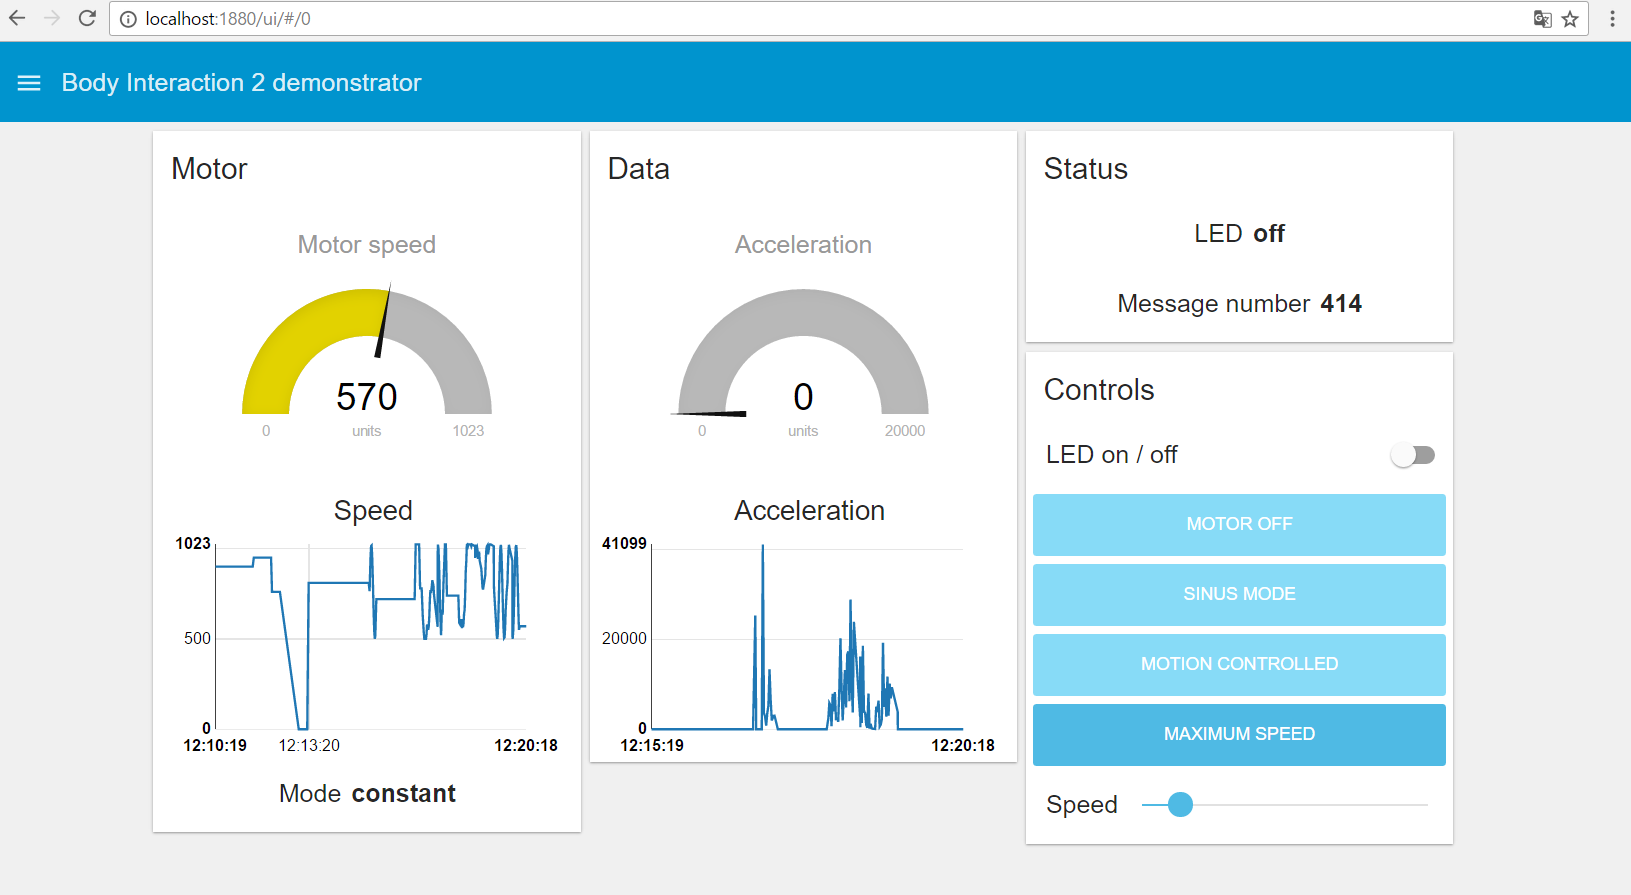
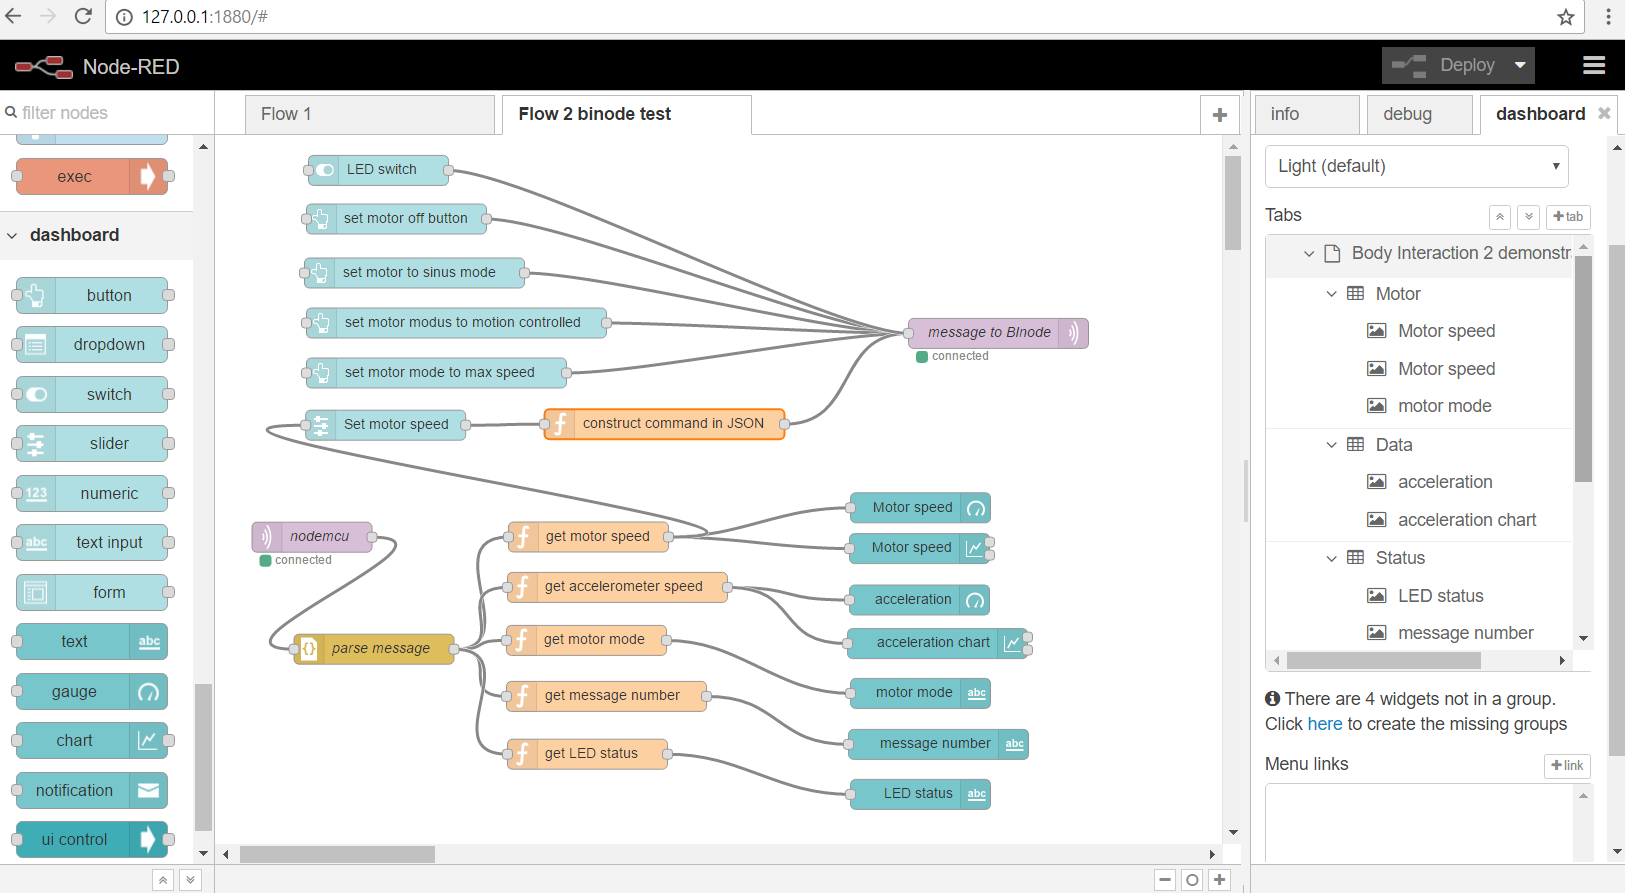
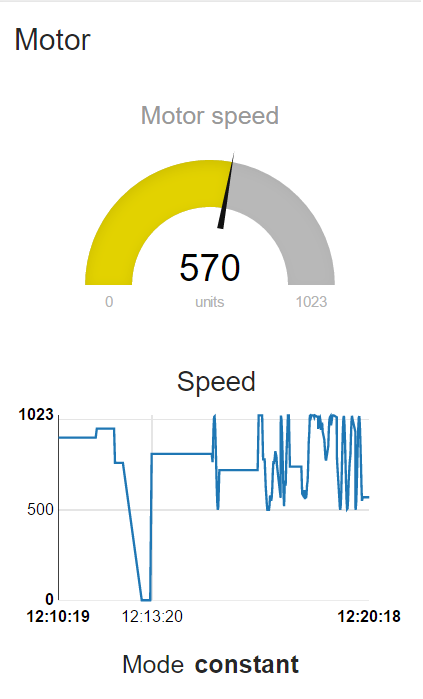
Now the data are continously sent to the Blynk app. To visualize the data we add the widget SuperChart.

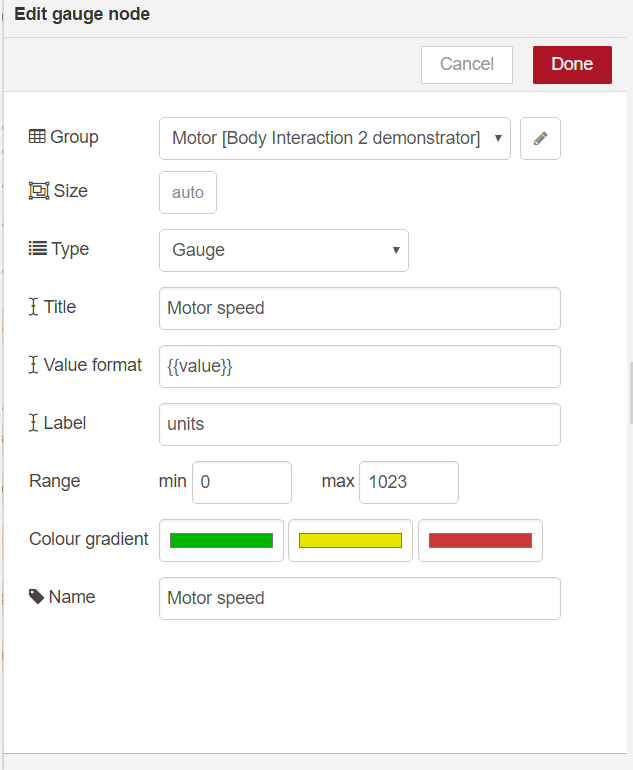
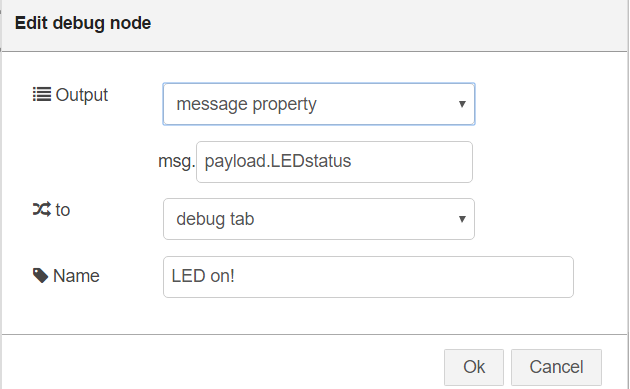
For each variable we have to define the input (virtual) pin. For pitch we use the virtual pin V2. In addition we define the color and style of the graph and more.


Finally the super graph shows us the date from the accelerometer which are updated every second.

First part of the tutorial (setup Arduino, setup Blynk, LED and motor control) is here

Here is the complete code:


/*************************************************************
bodyinteraction.org
sample program for reading MPU data, setting LED color and motor speed
*/
#define BLYNK_PRINT Serial
// include this library in the Arduino library manager
#include "FastLED.h"

// How many leds in your strip?
#define NUM_LEDS 1
// LED data pin is connected to pin?
#define DATA_PIN 14

// Define the array of leds
CRGB leds[NUM_LEDS];
int wave;

// include this library in the Arduino library manager
#include <MPU9250_asukiaaa.h>
MPU9250 mySensor;
float aX, aY, aZ, mDirection, pitch, roll, yaw;

#include <ESP8266WiFi.h>
#include <BlynkSimpleEsp8266.h>

// You should get Auth Token in the Blynk App.
// Go to the Project Settings (nut icon).
char auth[] = "Your Auth Token XXXXXXXXXX";

// Your WiFi credentials.
char ssid[] = "YOUR SSID   XXXXXXXXXXXXXX";
char pass[] = "YOUR Password XXXXXXXXXXXX";
BlynkTimer timer;

void myTimerEvent()
{
  // read acceleration data
  mySensor.accelUpdate();
  aX = mySensor.accelX();
  aY = mySensor.accelY();
  aZ = mySensor.accelZ();
  // read gyroscope update
  mySensor.magUpdate();
  mDirection = mySensor.magHorizDirection();
  // calculate pitch, roll, yaw (raw approximation)
  float pitch = 180 * atan (aX/sqrt(aY*aY + aZ*aZ))/M_PI;
  float roll = 180 * atan (aY/sqrt(aX*aX + aZ*aZ))/M_PI;
  float yaw = 180 * atan (aZ/sqrt(aX*aX + aZ*aZ))/M_PI;
  // send data to app via virtual ports, e.g. virtual pin V2 is set to pitch
  Blynk.virtualWrite(V2, pitch);
  Blynk.virtualWrite(V3, roll);
  Blynk.virtualWrite(V4, yaw);
  Blynk.virtualWrite(V5, mDirection);
}

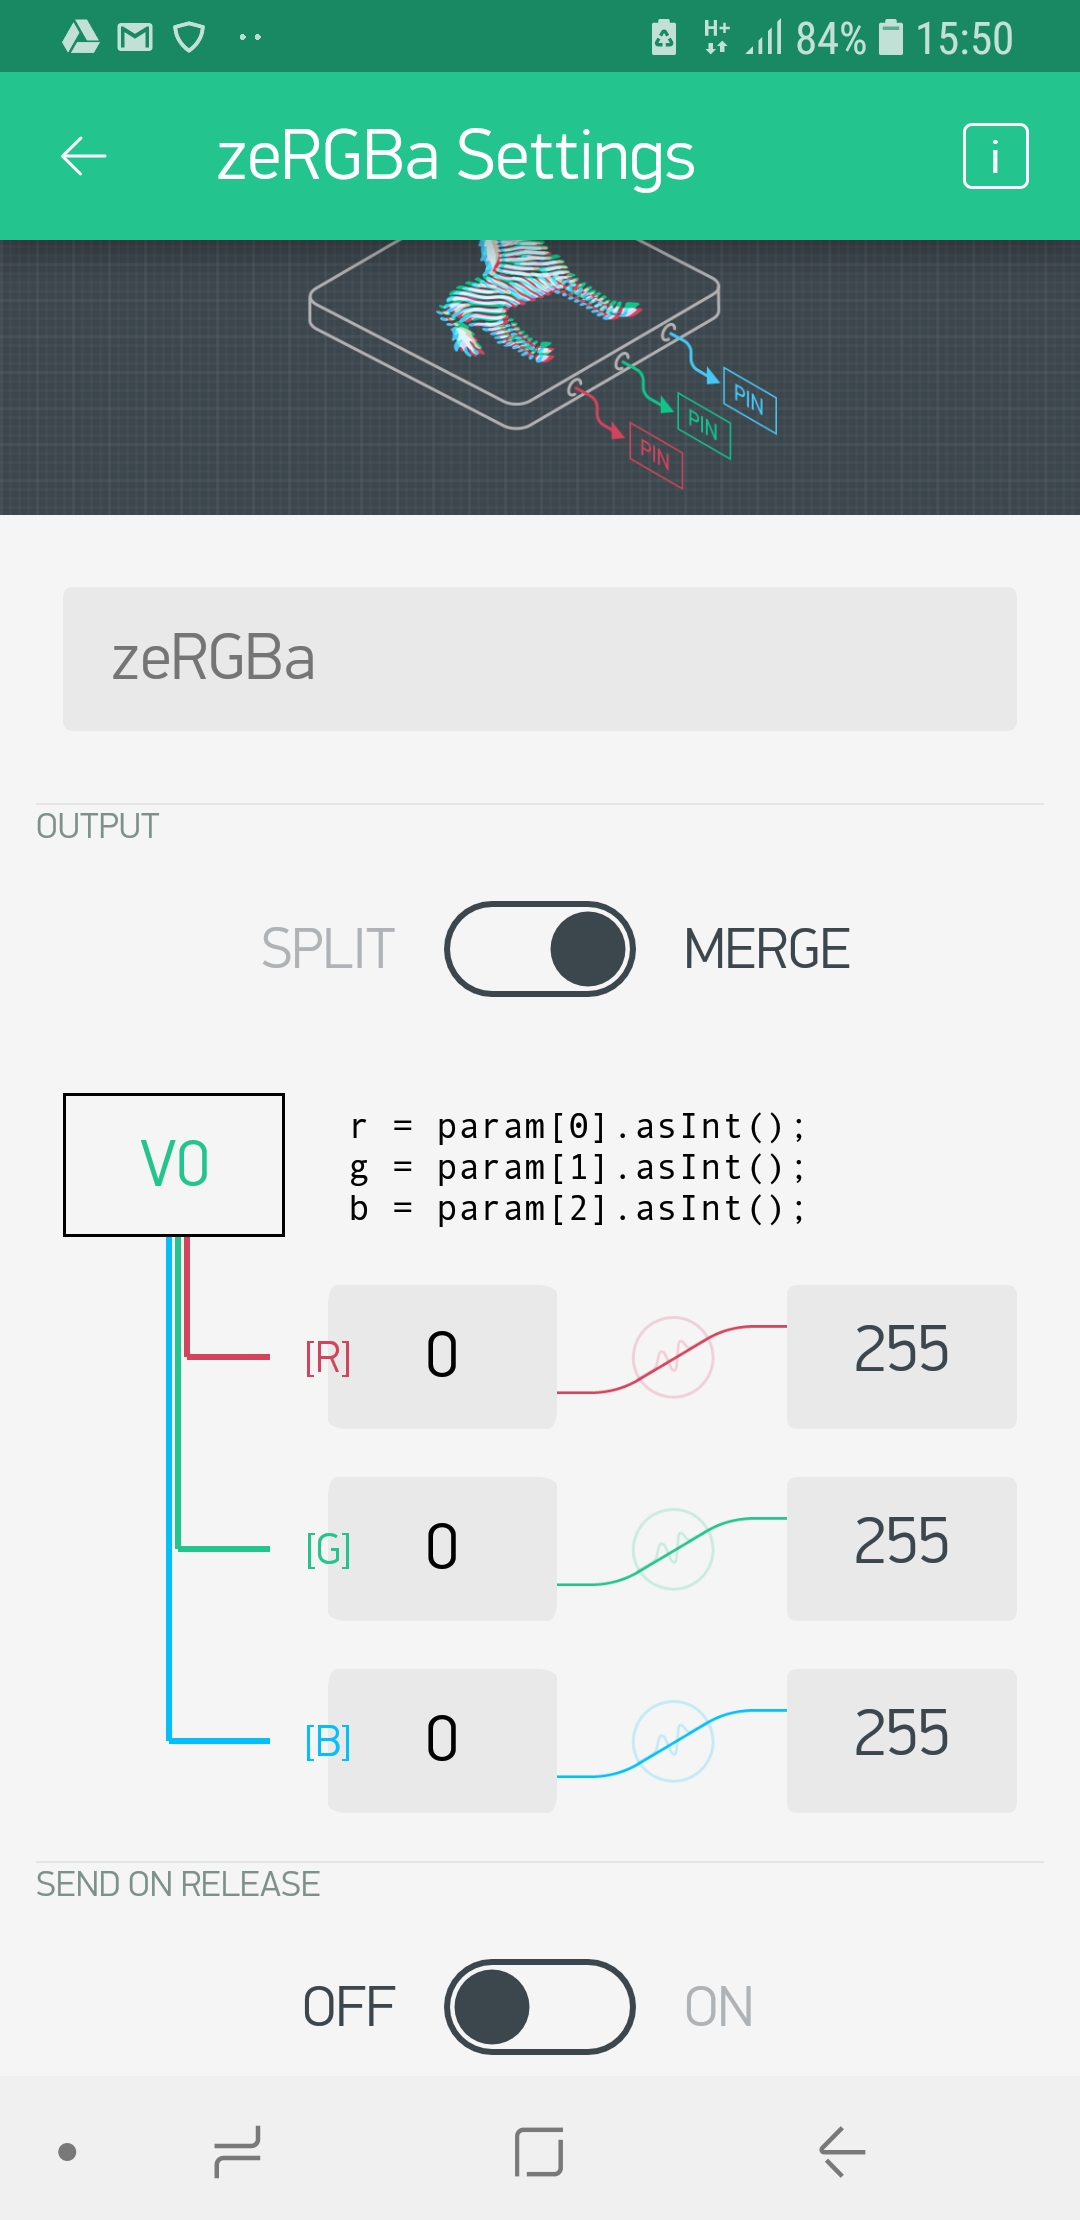
BLYNK_WRITE(V0) // set RGB color values which are transmitted from the app as V0 (virtual pin 0)
{ 
  int i = param[0].asInt();
  int j = param[1].asInt();
  int k = param[2].asInt();
  leds[0].setRGB(j,i,k);
  FastLED.show();
}

void setup()
{
  Serial.begin(115200);
  FastLED.addLeds<WS2812B, DATA_PIN, RGB>(leds, NUM_LEDS);

  Wire.begin(4, 5); //sda, scl
  mySensor.setWire(&Wire);
  mySensor.beginAccel();
  mySensor.beginMag();

  Blynk.begin(auth, ssid, pass);
  timer.setInterval(1000L, myTimerEvent);
}

void loop()
{
  Blynk.run();
  timer.run(); // Initiates BlynkTimer
}


Please feel free to comment or write to jacardano@gmail.com

Blynk: Controlling BI2 from the smartphone

Readers ask me for an easy way to control the body interaction vibrator development board. Without or with limited  programming knowledge, without complicated Internet of thing technology, like the visual programming tool NODERED or the MQTT protocol and server.

That’s what Blynk is for. Started in 2016 as a kickstarter  campaign, they have built a tool which hides a lot of the complexity of the Internet of Things. Blynk consists of the following parts:

Blynk app. With this app you can build a User Interface in just a few minutes. You have all the usual elements like switches, slider,  graphs and much more for controlling IOT devices.

Blynk Server / Cloud is responsible for the communications between the smart phone and IOT devices. There is nothing to do, everything works in the background

IOT devices library: So far everything is very simple. But at the end you have to program your IOT device – the body interaction 2 board for example. They support a great number of boards. For this they created the blynk  library – with the library you need only some lines of code which must be uploaded to the board. Even when you change the user interface the code can stay the same. At least for simple changes. They offer a code generator where you code for your board and use case is generated automatically.

You find a lot of information in the Internet about the pros and cons. In short: It is easy compared to other tools, but if you want to implement your own algorithms programming knowledge is needed. Blynk limits the number of free User Interface elements. If you need more you have to pay  a small fee.


Here is short tutorial to run you BI2 with Blynk. (takes 30 minutes)

Download the Blynk app (Android or iPhone).

Within the Blynk app: Register for Blynk and get AUTHenitfication code.

Upload Arduino

You can download Arduino from the Arduino Website or from the Microsoft Store (Windows only)


Add or update the following libraries with the library manager: FastLED and Blynk.

Select Include libraries -> library manager

Search for FastLED and install this library (press install button).

Now search for “Blynk” and install the Blynk software. However Blynk suggests to install the Blynk app manually.


Add board definition for the ESP8266

Select Tools -> Board -> Board management

Search for ESP and install “esp8266”

Select Board -> Adafruit Feather

Build a connection between BI2 and your computer.

First download the USB driver from here and install the driver. Connect the BI2 with your computer. After some while windows will notice a new device. Windows will communicate with the board over a COM port (e.g. COM3). If you have any problemes check your USB wire. It must support all lines, not only + and – for charging.

Now go back to Arduino and select Tools -> Port. Select the new COM portcom port arduino

Compile and upload the code to BI2 board

Now copy and paste the following code in a Arduino sketch (use File -> new). Then press the Upload button.

/*************************************************************
Controling the body interaction 2 board with the Blynk app
*/

#define BLYNK_PRINT Serial
#include <ESP8266WiFi.h>
#include <BlynkSimpleEsp8266.h>

// Auth Token infor the Blynk App.
char auth[] = "XXXXXXXXXXXXXXXXXXXXXXXXXXX";

// Your WiFi credentials.
char ssid[] = "XXXXXXXX";
char pass[] = "XXXXXXXX";

// Library for controlling the WS2821B (Neopixel) LED or LED strip
#include "FastLED.h"
#define NUM_LEDS 1 // number of LEDs
#define DATA_PIN 14 // pin for LED
CRGB leds[NUM_LEDS]; // define the array of leds

// This function set the LED color according to the selected RGB values in the app.
// RGB values are controlled in the app with zeRGBa widget
// values are stored in the virtual pin V0
// V0 consists of 3 values for Red, Green, Blue
BLYNK_WRITE(V0) // set LED RGB color values
{
  int i = param[0].asInt();
  int j = param[1].asInt();
  int k = param[2].asInt();
  leds[0].setRGB(j,i,k);
  FastLED.show();
}

void setup()
{
  // init LEDs
  FastLED.addLeds<WS2812B, DATA_PIN, RGB>(leds, NUM_LEDS);

  // connect to Blynk
  Blynk.begin(auth, ssid, pass);
}

void loop()
{
  Blynk.run();
}

You have to change AUTH. Use the AUTH code / token that was sent to you during Blynk registration. Then you have to change the WLAN credentials. Use the name of your network (SSID) and its password. (Depending on the maximum voltage of the vibration motor you have to adjust i, j and k e.g. for a 1.5V motor divide the variables by 3.

Configure the Blynk app

Create a new project and choose this device: ESP8266. Now add user interface elements – they are called widgets -to control the BI2. You can move and resize, add and delete each widget. Press on the widget to enter parameters like GPIO port etc. The app could look like that but you may position the widgets as you like. [The pitch, roll, yaw text fields can be omitted. They are introduced later.]

Add the following Widgets

Press the “+” button and add this widget:

zeRGBA: With this tool you can control the WS2821B LED

Choose select pin V0 = Virtual Pin 0.

Choose Merge.

Send on release: off

Add Sliders

Press the “+” button and add two sliders, one for each motor.

1st silder: Select Digital Pin 12 (PWM)

2nd slider:  Select Digital Pin 13 (PWM)

Add Button

Press the “+” button and add the button widget. Select pin digital – gp0. Set mode to “switch”.

Start the app

Therefore press the Run (or play) button (top left).


Done!

Questions? Reply to this post, via wordpress or to jacardano@gmail.co


Internet of (sex) things – part 4: Building a sex toy dashboard with Node-RED

In the fourth part of the tutorial we explain the development of a dashboard for our sex toy.

The series has 4 parts:

part 1: Exploring the internet of (sex) things

part 2: MQTT messages

part 3: Node-RED

part 4: Building a sex toy dashboard with Node-RED

The dashboard is used to visualize certain data eg. the speed of the vibration motor and the movements of the vibrator. In addition it can have some control elements eg. for changing the vibration pattern.

ui-all

The window above is called a tab. You can have multiple tabs. The Motor, Data, Status and Controls – windows are called groups. The Controls – group has buttons to set the motor mode. In addition there is a slider which will set the motor to a constant speed. And there is an on/off button for the LED.

You have to install the Node-RED dashboard. Therefore you need at least version 0.14 of Node-RED. At the time this text was written the standard Node-RED installation is version 0.13 which is not sufficient for the dashboard.

Therefore check your Node-RED version. If it is equal or better than 0.14, skip this step:

  • Download & unzip the latest version from github (eg. https://github.com/node-red/node-red/releases/tag/0.15.2).
  • Now change to newly created directory eg “node-red-0.15.2”
  • On Windows: Start a command shell in adminstration mode
  • Execute “npm install” to install Node-RED.

If your Node-RED version is 0.14 or better install the dashboard:

Some  remarks:

Let’s start and have a look at the new Node-RED interface: On the left side you will find the dashboard or user interface nodes. And on the right side there is new dashboard – tab. It contains all dashboard nodes which are used in the flow ordered hierarchical.

node-red-ui

But where is the dashboard? Just open your browser and go to one of the URLs:

http://localhost:1880/ui/#/0 or
http://127.0.0.1:1880/ui/#/0

How can I get all the flows? You can download all flows here: bi-ui-node-red. Unzip the file and you will get a text file. Open the text file in an editor. Select the text and copy it to the clipboard.

Now we will explain two flows in detail.

Now go the Node-RED window, open the menu (it is on the left top side), select Import -> Clipboard.import1

A new window will open where you can insert the text (CTRL+V). Then press the Import-button.

import2

nodemcu prototype breadboardThe Arduino sketch was updated for the dashboard. Please download the Arduino sketch from here: iost-part4-v12. Unzip the file. Compile and upload to your hardware (see part 1 of the tutorial).


In the first flow we will receive some vibration motor sex toy data which are sent by the MQTT protocol. We will display the data using a gauge and a graph element.

Let’ start with the MQTT input node. There is nothing new. Just connect to the MQTT server and subscribe the topic “BIoutTopic2” – which the sex toy uses to send out data.mqtt-in

Now add the function node “JSON” which will parse the incoming message and places the result in “payload”.

But we want to know the motor speed only. Therefore we need a function node which passes the vibration motor speed as payload and deletes all other data. Please use the following JavaScript code:

get-motor-speed-function-node

To display the speed we need to more nodes. The gauge node gauge-node displays the actual speed. Connect the gauge node with the function node. You can add the range – the minimum and maximum value (0 and 1023).motor-gauge


Now add a chart node chart-nodeand connect it with the function node, too.


Next we want the chart node and the gauge node to be together as shown in the next image.

motor

We have to make a group and put both nodes into the group. Have a look on the dashboard at the right side. Make a new group and move the gauge and chart node below the group called “Motor”.

dashboard-top

slider-nodeNow we explain the second flow. It is used to send commands to the sex toy. We will use a slider to control the speed. But there is one problem: the slider should display the actual speed of the vibration motor. Therefore we manipulate the slider. To display the actual motor speed we have to move the slider appropriate to the actual speed. The slider will be part of the control group:

controls

Now get the slider node and edit the node as follows:

slider-motor-speed

Then connect the node with the “get motor speed” function which was introduced in the first flow.

construct-json-motor-speed-function-nodeFinally comes the trick part. Get a new function node and connect it with the slider. This node will construct the JSON message which will be sent to the sex toy using MQTT. The JavaScript code of the function node is as follows:

function-node-for-constructing-json-speed-command

msg.payload={messageType:"execute", actuator:"motor1",
             actuatorMode:"constant", actuatorValue:msg.payload}
msg.topic = "BIinTopic";
return msg;

Now connect the function node with a new MQTT output node. Leave the topic empty as it will be passed from the input nodes:

mqtt-out-message-to-bi

Using Node-RED with the Node-RED dashboard we are able to make a user interface for our sex toy(s). We could easily display the motion of the sex toy as well as the vibration motor speed. You could argue that we had a (very simple) user interface already in part 1 of the tutorial, without having to use MQTT, Node-RED and the Node-RED dashboard. That’s true. But imagine you have several sex toys and want to control them. You could easily add a tab in Node-RED for each sex toy. Or you could build more sophisticated flows incorporating several sex toy. Why not interconnecting the vibrating necklace with a penis ring and one of the plugs or dildos?

There are a lot of flows and nodes already available at http://flows.nodered.org/. (Of course not in the sex toy domain)

Why not play music for a given sex toy vibrator mode? Or control the sex toy using another IOT device…

Internet of (sex) things – part 3: Node-RED

in the second part of this tutorial we have seen how to use the MQTT protocol to send data across the internet. In the third part we show how to add additional functionalities to our sex toys.

The series has 4 parts:

part 1: Exploring the internet of (sex) things

part 2: MQTT messages

part 3: Node-RED

part 4: Building a sex toy dashboard with Node-RED

We want to enable sex toys to communicate and  to connect to social media. Although there are a lot of solutions from the Internet of Things (IoT) community Node-RED is outstanding as you could connect devices without or with little knowledge of programming languages: “NodeRED is a visual tool for wiring together hardware devices, APIs and online services – for wiring the Internet of Things.”  (Wikipedia). There are standard building blocks (called nodes) which are categorized as input, output, function and social nodes. You can select nodes and wire them to create a flow. A typical flow would look like that: input node- function node- output node. If you want to know more you can should have a look at this very good tutorial: http://noderedguide.com/

In this part of the tutorial we will receive and display data from the sex toy. And we want to send control commands to the sex toy. This can be achieved with a few flows in Node-RED:

node-red-overview

Installation of Node-RED:

  1. First you have to install “node.js”. Follow the instructions here.
  2. Now follow the node-red installation instruction.
    For Windows: Press the Windows button. Type in “CMD”. Windows should suggest the command shell app. Now RIGHT-click on the command shell app and select “open as administrator”. In the new command shell window type in

    npm install -g --unsafe-perm node-red
  3. Change to the Node-RED directory and start Node-RED by the command “node red” or “node red.js”
  4. Go to your browser and open http://127.0.0.1:1880/

If you don’t want to make a local installation of Node-RED the online service FRED (https://fred.sensetecnic.com/) offers a good alternative. FRED comes with additional nodes with extra functionalities.

Let’s start with a first flow. We want to control the LED and the motor of our IoT sex toys. Therefore we need two nodes: The input node “INJECT” and the output node “MQTT”. Select both nodes and drag them into the flow window in the middle. Wire both nodes. Then open the Inject-node (just double-click the node). Change the  payload to type “string” and type in the command for switching the LED. This command is taken from the second part of the tutorial:

{messageType : "execute",  actuator : "LED",  actuatorValue : 1 }

In addition you have to enter the topic that will be used for the MQTT message. It is “BIinTopic” – the “in” refers to the sex toy. Select a name like “set LED on”:inject-mode-led-on

Then edit the MQTT node. The name of the MQTT server must be entered. Leave the Topic field empty and the MQTT node will use the topic from the predecessor node INJECT.

mqtt-out-message-to-biNow press the deploy button. You should see the message “successful deployed”.

Now you can press one of the INJECT node button (the button is on the left side of the node) and the LED of the sex toy should go on.controlbi2byrednode

You can use the JSON commands from part 2 of the tutorial and make an INJECT node for each command. With just 5 flows you can control all functions of the vibrator from everywhere. Instead of the INJECT node you could use an Email or Twitter node (instead of the INJECT node) to control the sex toy eg by Email.

There are no file open or save menus in Node-RED. Instead the visual flow can be imported and exported using a simple text file. If you want to import the flow above download and unzip this text file. Select Import -> from clipboard and copy the text from the file to the clipboard. If you want to save the flow, select Export -> from clipboard and copy the text of the clipboard in a new text file.

Now let’s receive messages from the vibrator and parse them. You need a MQTT input node, a JSON function node, a SWITCH node and two DEBUG output node.

We will show how to retrieve the status of the LED. When the LED is on the JSON file includes: “LEDstatus: 1”. Otherwise the JSON file includes: “LEDstatus: 0”.

Edit the MQTT input node and enter the URL of the Mosquitto server and the topic “BIoutTopic”.

mqtt-in

Then add a DEBUG node and select “complete msg”. Wire MQTT and DEBUG node. This node will display the MQTT message in the debug slider (on the rights side). This is only for debugging – you will see if the message from the vibrator comes in (or not).

Now add a JSON function node and connect the MQTT node with the JSON node. The JSON function node will parse the text string which was sent via MQTT and transforms it to a JSON object.

Now select a SWITCH node. As property enter “payload.LEDstatus”. The switch node branches the flow according to LED status which was reported in the JSON file. Now we can test, if the LEDstatus is 0 or 1. For each comparison a line will be added.json-switch-node

Finally make two DEBUG output nodes and wire them with the SWITCH node. Complete the “msg” by adding “payload.LEDstatus”. If the flow reaches the DEBUG nodes you will see a message in the debug slider on the right.

ouputnodeled


Now you are ready and can press the deploy button. It should look like that:

analyse-json

Again, the visual flow can be imported. If you want to import the flow above download and unzip this text file. Select Import -> from clipboard and copy the text from the file to the clipboard.

Let us test the flow. You have to set the LED on. Press the “turn on” button in your browser as explained in part 2.vibr iot controlnodemcu prototype breadboard


Now have a look at the “debug” slider where you should see the result of the action. The first entry is the JSON file which was received. It is displayed by the DEBUG node “message”. In the second entry the DEBUG node (wired with the SWITCH node) displays 1 which means the LED is on.debug-window-led-on


With Node-RED you can add a SQL database to store all data, you can connect to social media and especially you can connect MULTIPLE sex toys and let them interact. Read the excellent guides for parsing JSON files and MQTT:

http://noderedguide.com/index.php/2015/10/28/node-red-lecture-3-basic-nodes-and-flows/#h.5zaw60nvfsyj

What we have achieved: In part 1 we have developed a wifi-enabled sex toy prototype based on the ESP8266. The toy was controlled through a web browser on a local smart phone / laptop. Local refers to the access point. Both the local smart phone / laptop and the ESP8266 must have access to the same access point (eg your router at home.)

In part 2 we opened our connections to the internet. With the fast MQTT protocol we are able to send and receive messages from anywhere. For data transmission  we use the JSON file format. We have sketched a protocol for sending data, commands and messages between sex toys and users.

In this part we introduced Node-RED a visual programming tool for the Internet of Things. With this tool we are able to connect sex toys at different locations, to store sensor data and to get social.

In the fourth part of the tutorial we will introduce User Interfaces to create a sex toy dashboard.

New vibrator design for the vibrator development board & 3d cases

Chain of Ball 2

Chain of Ball Vibrator design with cap

The new design catches the “chain of balls” design theme used in some sex toys. It was constructed in Tinkercad and it is really simple to do it on your own. This how-to video explains the construction in detail.


many balls body interaction vibrator development board

The design is composed from several spheres

Try it on your own in Tinkercad. Just grab a sphere, make a copy, resize the copy, make a copy again and repeat this until you have a chain of spheres. Now select all sphere and use the “align” tool. That’s it.

The tricky part is the screw cap. This is needed to enclose the body interaction vibrator development board.


Chain of Ball vibrator being printed

Chain of Ball vibrator being printed in ABS, XYZ printer 1.0, on the bottom is the support material

Visualize and publish sex toy activity – part 2

In the first how-to we explained how-to upload the data of the body interaction vibrator development board to a database.

Now we want to show you how easy it is to visualize the motion data of one or more body interaction boards. And in the last part of the how-to we set up a webserver. So you can share your activity data with other.

BI activity 3+ HTML

Web form for ploting your sex toy data

What could we learn from this data:

  • how often people use sex toys
  • how long is a typical session
  • motion frequency analysis for orgasm detection

There are manifold application areas for this data:

  • compare (and compete) with others
  • quantify yourself
  • learn more about the quality of sex
  • share benefitable sex toy usage pattern

You could also combine the sex toy data with other fitness data and learn how sex eg. influences your health.

That’s the end of the “record and share sex toy data” series. We would like to know what you think about this. Does it make sense? To complex? Should we develop a body interaction “base station” with a web server? Or would you prefer an app for your smartphone?

Figure: Activity of 3 BI boards over time. Each color represents one BI which has a distinct node ID.

Figure: Activity of 3 BI boards over time. Each color represents one BI which has a distinct node ID.

How a program for the body interaction 1 works

The P5_fin script (program) is the basic Arduino script which demonstrates all functions available:

  • The speed of the vibration motor is controlled by movements.
  • Movement data are sent to other body interaction boards.
  • Vibration strength is adjusted when near by body interaction boards have different speed

BI1 interaction pattern

How it works:

The P5_fin script reads data from the accelerometer. Depending of the measured motion the vibration motor is speed up or slowed down. (Slow motion = reduce vibration motor speed, fast motion = speed up).

When the measured motion changes the motion data are sent out and can be received by other BI1. At the same time this script listen to other body interaction boards which send their motion data to all listening nodes.

CodebenderWithBI script and parametersWhen the measured motion of other body interaction board are different from the motion measured by this script, the vibration motor is adjusted (speed up or slowed down). So two or more body interaction boards can influence each other and synchronize after some time. The documented script is available in codebender. In this how-to the uploading of the script is explained.


%d bloggers like this: